This function creates a time plot for a given variable in the data.
Usage
timePlot(data, var, size, span)
Arguments
- data
A data frame containing the data.
- var
A character string representing the variable to be plotted.
- size
A numeric value representing the size of the points in the plot.
- span
A numeric value representing the span for the loess smoothing.
Value
A ggplot2 object representing the time plot.
Examples
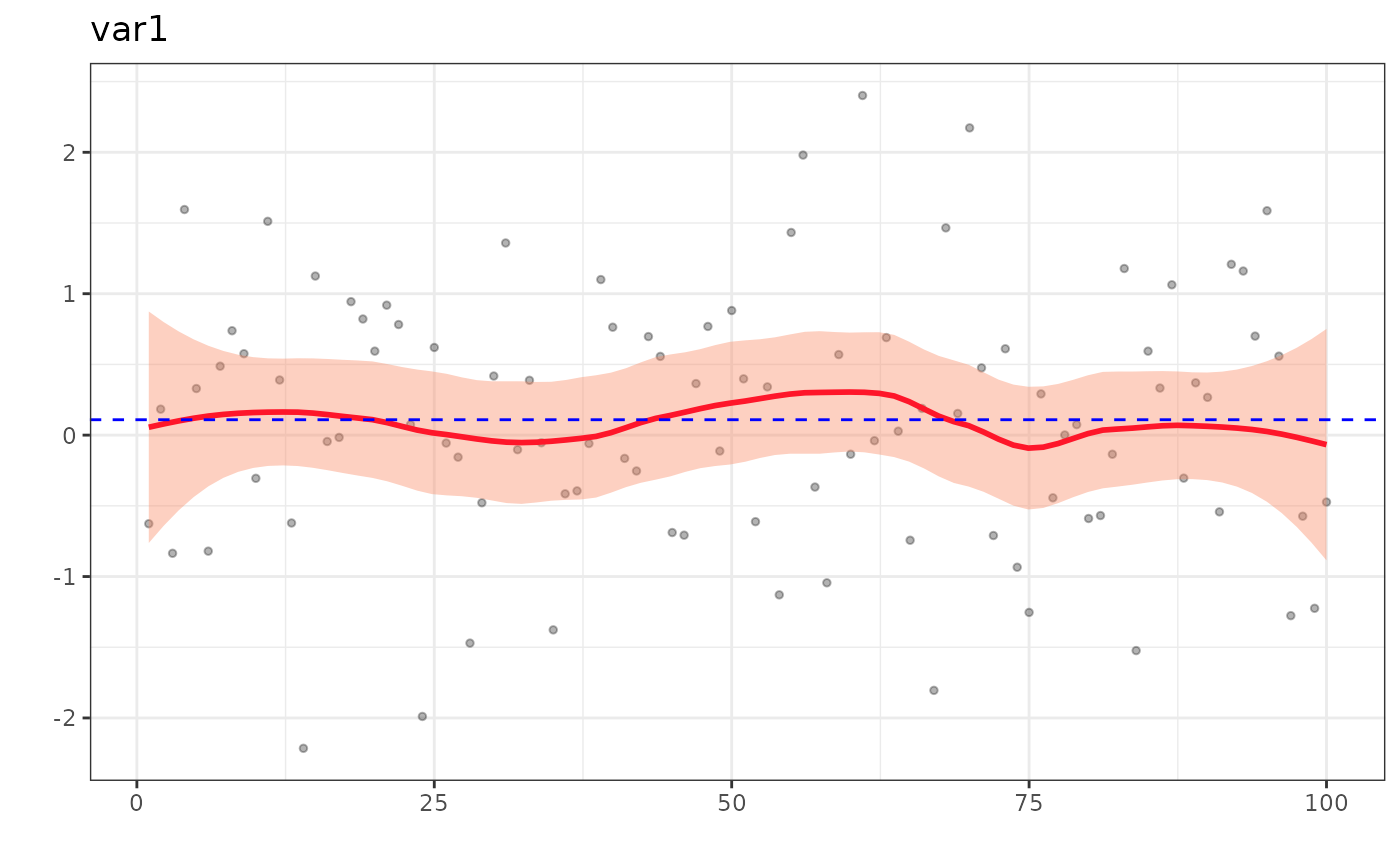
set.seed(1)
data <- data.frame(
    measure_time = seq(1, 100, by = 1),
    var1 = rnorm(100),
    var2 = rnorm(100)
)
timePlot(data, var = "var1", size = 1, span = 0.5)
#> `geom_smooth()` using formula = 'y ~ x'